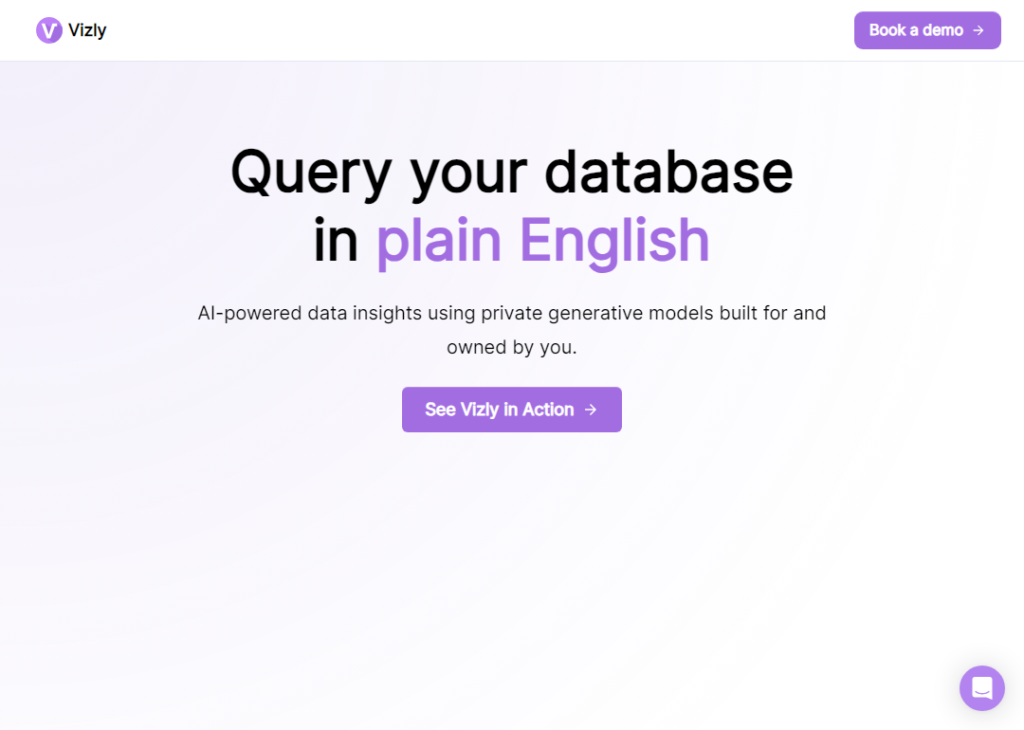
Generated by Gemini:Vizly is a data visualization tool that uses AI to help users create interactive dashboards from their data in seconds. It is designed to be easy to use, even for users with no prior experience with data visualization.
To use Vizly, users simply need to upload their data to the platform and then ask Vizly a question about their data. Vizly will then generate an interactive dashboard that answers the user's question.
Vizly offers a wide range of visualization options, including charts, graphs, maps, and tables. Users can also customize the appearance of their dashboards to match their needs.
Vizly is a valuable tool for anyone who needs to create data visualizations, such as:
- Business analysts
- Data scientists
- Market researchers
- Sales professionals
- Educators
- And much more
Vizly is available as a free plan and a paid plan. The free plan allows users to create up to 10 dashboards per month. The paid plan offers additional features, such as unlimited dashboard creation, custom branding, and team collaboration.
Here are some of the benefits of using Vizly:
- It saves time and effort: Vizly's AI-powered data visualization features can save users a lot of time and effort. Instead of having to manually create data visualizations, users can simply ask Vizly a question about their data and Vizly will generate a visualization for them.
- It makes data visualization more accessible: Vizly is easy to use and does not require any prior experience with data visualization. This makes it a valuable tool for people of all skill levels to create data visualizations.
- It produces high-quality results: Vizly is able to produce high-quality data visualizations that are both informative and visually appealing.
Overall, Vizly is a powerful and versatile data visualization tool that can be used by people of all skill levels to create interactive dashboards from their data in seconds. It is a valuable tool for anyone who needs to create data visualizations, such as business analysts, data scientists, market researchers, sales professionals, educators, and much more.
